
In terms of longer-range pet ownership trends, Simmons data indicate that dog ownership in the US has notched up over the last 12 years, from 34 percent of households to 39 percent in 2017, while cat ownership rates have remained flat at 25 percent.
Pet ownership growth inside and outside metropolitan areas
Breaking out the trends by metropolitan size classification shows that, perhaps surprisingly, both dog and cat ownership rates have increased significantly only for households geographically outside of the top 100 metro areas (see Table 1). Dog but not cat ownership rates have increased significantly in the Top 20 metro areas, while in the middle metro areas, or Top 21–100, dog ownership rates have made relatively moderate gains while cat ownership rates have dipped.
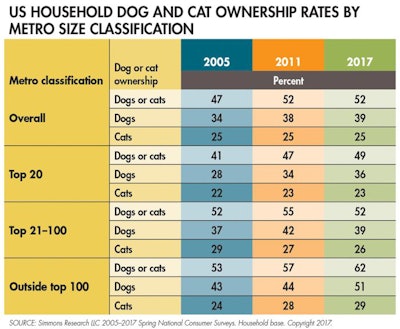
TABLE 1: By percentage of households, those outside the top 100 metropolitan areas are seeing pet ownership growth more significantly than those inside the top 100, according to research.
In absolute numbers, pet ownership gains are mostly about the top 20 metropolitan areas. Of the 11.5-million-household increase in the number of dog-owning households over the 2005–2017 period, the top 20 metro areas account for 7.0 million, or 63 percent. In the case of cat-owning households, the top 20 metro areas account for 2.1 million out of a 2.6 million increase between 2005 and 2017, or 81 percent (see Figure 1).
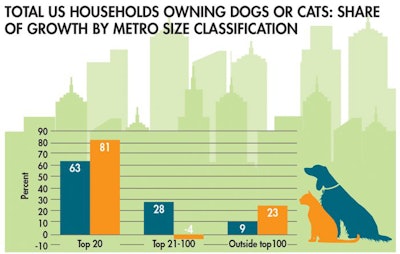
FIGURE 1: Cat ownership is actually decreasing among those living in the top 21-100 metropolitan areas. | Images courtesy hanss.Fotolia and Michele Paccione.Fotolia
Human population patterns and pet ownership trends
These gains are in keeping with, but do not merely echo, larger population patterns. For the US overall, the total number of households expanded 11 percent between 2005 and 2017, while the number of dog/cat-owning households grew by 22 percent (see Figure 2, Table 2). The total number of households in the top 20 metro areas grew by 16 percent over this period, while the number of dog/cat-owning households in these largest cities jumped by 38 percent.
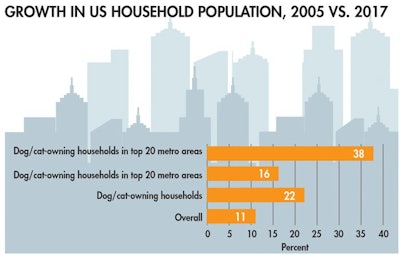
FIGURE 2: Taking a closer look, pet ownership growth is even outpacing household growth in the top 20 metropolitan areas. | Image courtesy hanss.Fotolia
Adjusting for the number of pets owned, which is lower on average for pet owners living in the largest urban areas, doesn’t dramatically change the big picture. For example, the top 20 metro areas accounted for 43 percent of dog-owning households in 2017, and pet owners living outside the top 100 metro areas accounted for 17 percent. Factoring in the greater propensity for households outside of urban areas to own more pets, Packaged Facts estimates that the top 20 metro areas account for 41 percent of the total number of pet dogs owned in 2017, and pet owners outside the top 100 metro areas account for 18 percent.
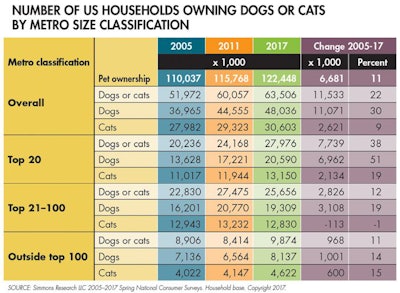
TABLE 2: In absolute numbers, unsurprisingly, those inside the top 20 metropolitan areas particularly continue to have the highest number of cats and dogs in their homes.
Metro classification, pet ownership and pet retail choices
One of the most dramatic effects of this “top metrofication” of pet ownership has been, and will continue to be, on pet product retail channel choices. Dog or cat owners who live in the top 20 metro areas account for 37 percent of households who buy pet products in discount stores such as Walmart and 41 percent of those who buy pet products in supermarkets, but for 52 percent of those who buy pet products online.
Over the most recent five-year period, the top 20 metro area pet product shopper base for discount stores has increased by only 4 percent, and for supermarkets by 17 percent, but has doubled online. With these sharply disproportionate growth rates in shopper bases, the balance of power between in-store and online pet product retailing is changing rapidly.
For more US pet market research


