Last month’s column, “US pet food market to reach US$27 billion in 2018,” noted that for pet owners, as for US consumers in general, spending management leads to strategic retail behavior including retail channel choice — or rather choices, with many shopping across multiple channels and retailers for bargains, brick-and-mortar and online, as well as trading up for priority products such as pet food and trading down for pet supplies segments seen as more discretionary or less impactful on pet health and wellness.
Influencers of pet food shopping channel choices
Therefore, the channels that claim double-digit shares of pet food retail sales not only span the mass versus class divide — supercenters/discount stores led by Walmart, pet specialty chains and grocery stores — but now include the internet, which now accounts for an estimated 11 percent of pet sales, as reported in Packaged Facts’ Pet Food in the US (December 2017).
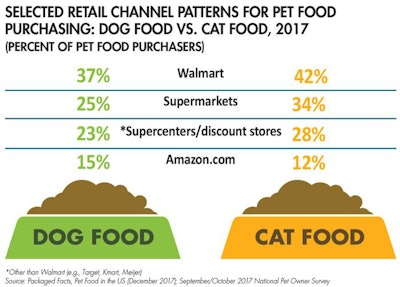
Patterns also diverge by type of pet. A far higher percentage of cat owners (34 percent) than dog owners (25 percent) buy pet food at supermarkets. Compared with dog owners, moreover, cat owners are significantly more likely to shop at Walmart or other supercenters/discount stores such as Target, while somewhat less likely to buy pet food on Amazon.com (see Table 1).

TABLE 1: The retail channels chosen for pet food purchases vary by both type of outlet and type of pet, among other things.
Channel choices also are shaped by generational demographics, and not just in terms of propensity to shop online. For example, Simmons Research Summer 2017 data show that the percentage of dog or cat owners who are pet supply customers falls by nearly half across generational brackets for Petco, at 32 percent of millennials age 18–34, but only 17 percent of seniors age 70+. The skew is similarly sharp for purchasing pet supplies over the internet and almost as marked for PetSmart, which sheds light on the intensity of the cross-competition among these retailers. Among those who purchase pet products online, two-thirds (65 percent) also buy pet products at PetSmart or Petco, while only a fourth (23 percent) also buy pet supplies at discount stores.
For discount stores, in turn, the percentage of dog or cat owners who are pet supply customers rises steadily up the age ladder from 17 percent of millennials to 28 percent of seniors. Among pet supply shoppers at discount stores, half (49 percent) also purchase these products at supermarkets, a higher proportion than those who also shop at pet superstores (41 percent).
Further complexities of shopping channel choices
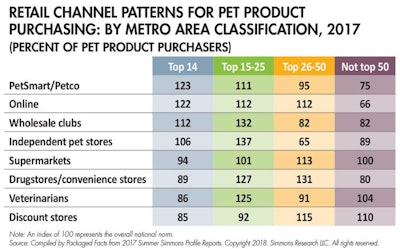
The complexities hardly stop there, of course. The national economic and political segregation raises the question of “blue state” versus “red state” patterns, though the question is more truly addressed in relation to metropolitan versus rural shoppers (see Table 2).

TABLE 2: Where pet owners live plays a significant role in their purchasing options and decisions.
Measured by shopping index, where an index of 100 reflects the overall national norm, Simmons data show that:
- Top 14 metro area pet owners are nearly one-fourth more likely than average to buy pet products at pet superstores or online (at indexes of 123 and 122, respectively), while pet owners outside of the top 50 metro areas are sharply less likely to do so (at indexes of 75 and 66, respectively.)
- Top 25–50 metro area pet owners are roughly a third more likely to buy pet products at wholesale clubs or independent pet stores, as are top 15–50 metro area pet owners for drugstores/c-stores.
- Top 14 metro area pet owners are significantly less likely than average to buy pet products at discount stores (at an index of 85), while pet owners outside of the top 50 metro areas are significantly more likely to do so (index of 100).
Patterns by metropolitan area are perhaps most striking in relation to veterinarians, in that top 14 metro area pet owners are significantly less likely than average to purchase pet supplies from their vet (index of 86), while top 25–50 metro area pet owners are significantly more likely to do so (at an index of 125). As medical and non-medical pet services become more integral to pet product retailing, especially in the case of the leading pet specialty and mass-market chain stores, this asymmetry becomes an important bone of pet market competition.
For more information on Packaged Facts’ new research report on Pet Food in the US, see https://goo.gl/dmyCCZ.
The latest pet food market insights:


