More companion animals in the United States, including dogs, cats, birds, small animals and horses, may receive pet treats now than in previous years. For all types of pets except reptiles, a growing percentage of US pet owners reported giving treats to their pets in respondents’ answers to the most recent American Pet Products Association’s 2017-2018 National Pet Owners Survey. For more information, see the infographic below.
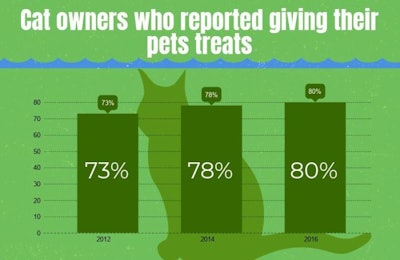
The largest increase was in the percentage of horse owners reporting that they give their pets treats. Cat owners saw the second largest increase. Between 2012 and 2016, this group grew by 7 percent. The smallest increase was among dog owners, a bump of two percent. However, dog owners were already the group with the highest percentage, so there wasn’t much room to grow. Reptile owners decreased slightly in the percentage giving treats dropping two percentage points from 56 percent in 2012 to 54 percent in 2016.
Pet food spending in the United States
In 2017, pet owners in the United States spent more on their dogs, cats, birds and other creatures than ever before, according to the APPA. Consumers spent US$69.51 billion in 2017. The 2017 pet industry spending numbers surpass the previous year's by nearly three billion dollars (US$66.75 billion spent in 2016), a 4 percent growth.
The largest percentage of total pet product spending in the US was on pet food. Approximately, $29.69 billion of the 2017 total went to pet food, according to APPA statistics.
Pet ownership in the United States
During the past two decades, pet ownership has risen consistently in the US, according to the survey. Sixty-eight percent of US households include a pet. Considering that the most recent census reported 124.6 million households, approximately 84.6 million households own pets. Of those households, 46 percent included multiple types of pets.
Dogs are the most common pets in the United States, followed by cats and then birds. Dog, fish and bird owners exhibited the highest rates of being married, while owners of small animals, fish, birds and reptiles were more likely than average to have young children at home. Cat and reptile owners tended to be unmarried at higher levels than the general population.
How National Pet Owners Survey was conducted
The National Pet Owners Survey included responses from 2,559 pet owners from various parts of the United States.
The survey included respondents from four generations:
- Gen Y (millennials) – aged 18-36; born 1994-1980
- Gen X – aged 37-51; born 1979-1965
- Baby boomers – aged 52-70; born 1964-1946
- Builders – aged 71+; born 1945-1920
Respondents answered one of eight sets of questions about specific types of pets, including dogs, cats, reptiles, freshwater fish, birds, saltwater fish, horses and small animals. Ipsos, Inc. conducted the survey.