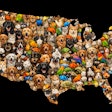
All the political attention to “red state” versus “blue state” raises the question of how this division plays out in the pet market. These cultural designations are of course drawing the wrong geographical boundaries, a practice long associated with politics. Rural versus urban is a more meaningful classification — which is why suburbs, wavering somewhere in the middle, are usually the real battleground.
Highlighting the 'urban versus rural' demographics
If we focus on urban versus rural, the most significant fact is that pet-owning households are skewing metro, in keeping with national population (and job) trends. The most recent Fall 2018 Simmons Market Research data show that, between 2008 and 2018, the number of households in the top 25 metro areas jumped from 56.0 million to 63.6 million, while the number not in the top 100 metro areas fell from 16.2 million to 15.7 million. Over this period, the number of pet-owning households in the top 25 metros increased from 28.2 million to 33.2 million, while slipping from 9.1 million to 8.8 million outside of the top 100.
At the same time, rural households come to the fore as multiple-pet owners, both by number and types of pets. Outside of the top 100 metro areas, for example, 21 percent of households own two or more dogs, compared with only 13 percent of households in the top 25 metros. Similarly, outside of the top 100, 16 percent of households own dog(s) as well as cat(s), compared with only 9 percent of households in the top 25.
When it comes to dog or cat product purchasing, patterns are often very comparable between urban and rural pet owners. The percentage who bought pet toys in the last 12 months — the top pet durables segment by this metric — is almost identical between those in the top 25 metros and those outside of the top 100, at nearly 29 percent. A similar equivalence holds for grooming supplies. Purchasing of pet apparel/fashion accessories or waterers/feeders skews slightly but not notably to urban pet owners, while the reverse holds true for pet beds or collars/leashes.
Specific data for pet food and treats
In the specific case of pet food and treats, purchasing patterns become more distinct. Purchasing of dry pet food is almost universal across dog owners (95 percent) and cat owners (97 percent), leaving little room for significant variation at the topline usage level (see Table 1). This predictability doesn’t hold, however, for either wet pet food or for treats:
- Dog owners in the top 25 or the top 26–100 metro areas are equally likely to purchase wet dog food (37 percent), compared to a significantly higher rate for dog owners outside of the top 100 (45 percent).
- Conversely, dog owners in the top 25 metro areas are somewhat more likely to buy dog treats (82 percent), compared with identical rates (77 percent) among those in the top 26–100 or outside of the top 100.
- Cat owners in the top 25 metro areas are significantly more likely to buy wet cat food (61 percent) compared to cat owners in the top 26–100 (at 53 percent) and, especially, to those outside of the top 100 (at 41 percent).
- Similarly, cat owners in the top 25 metro areas are more likely to buy cat treats (59 percent) compared to cat owners in the top 26–100 (52 percent) or, even more so, to those outside of the top 100 (47 percent).
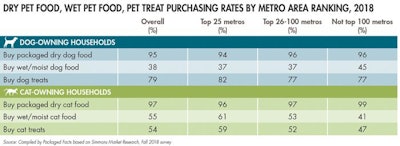
TABLE 1: The vast majority of pet owners, no matter where they’re from, still purchase dry dog and cat food.
Usage variations among urban versus rural pet owners tie in to brand as well as retailer dynamics, at which level of complexity it becomes dangerous to paint in broad strokes. In the case of wet dog food, for example, both Alpo and Walmart’s store brand Ol’ Roy are over twice as popular in rural areas as they are nationwide. Nonetheless, overall usage rates for wet food are identical for dog owners who shop in the feed & seed channel (the most rural of pet product channels) and those who shop in the pet superstores (the more urban).

