U.S. dog owners spent an average of US$287 on dog food in 2020, while cat owners spent US$254 on cat food. Both amounts represented an approximate 11% increase from two years before.
The data came from the American Pet Products Association (APPA) National Pet Owners Survey, last conducted in late 2020/early 2021. With the survey taking place every two years, the comparison year was 2018, said Julie Springer, APPA market research analyst, during a recent Petfood Industry webinar, “2022 global pet food market trends.”
In addition to the pet food spending averages, Springer showed that U.S. dog owners spent an average of US$81 on dog treats in 2020, up 6.5% from 2018, and cat owners spent US$72 on cat treats, a robust 24% increase over 2018.
Springer also shared data on types and attributes of pet food products purchased; and she and her co-presenter, Lindsay Beaton, editor of Petfood Industry, both spoke to the boom in buying pet food and treats online.
Premium over ‘basic’ dog food, natural still fairly popular
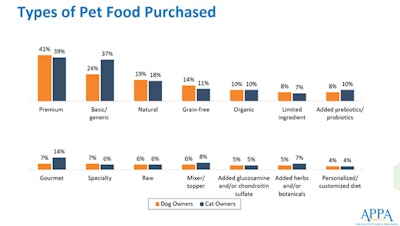
In 2020, slightly more dog owners, 41%, bought premium dog food than “basic/generic,” at 39%, according to the APPA survey. For cat owners, the ratio was flipped, with a higher level purchasing basic/generic cat food at 37%, compared to 24% for premium.
Other types of food purchasing that APPA surveyed included natural (19% for dog owners, 18% for cat owners), grain free (14% dog, 11% cat), organic (10% each), limited ingredient (8% dog, 7% cat) and personalized/customized diet (4% each). APPA also measured purchases of certain pet food attributes, such as non-GMO (19% dog, 16% cat), human-grade ingredients (13% dog, 10% cat), environmentally friendly packaging (12% dog, 15% cat), sustainable/humanely sourced ingredients (7% dog, 8% cat) and ancient grains (3% each). Those percentages tracked very closely for pet food attributes that survey respondents said they plan to buy in the future.

U.S. dog and cat owners purchased various types of pet foods in 2020, according to the APPA National Pet Owner Survey.
Finally, in terms of pet food subcategories, the APPA survey showed that dog and cat owners purchased certain specialty formulations, including weight control (11% each), digestive health (20% dog, 18% cat), coat/skin (20% dog, 11% cats) and, specific to cats, indoor formulas (42%) and hairball management (17%).
Interestingly, 17% of dog owners and 14% of cat owners reported buying senior pet formulas, compared to only 10% each for puppy and kitten formulas—perhaps tracking with new pet additions during the first year of the pandemic but also indicating that not all new furry family members were puppies or kittens. As well, it speaks to the fact that beloved pets are living longer, pandemic or not.
Rise of online pet food buying, whether home delivery or pick up in store
While the survey data Springer shared showed just 20% of dog and cat owners purchased pet food from online-only outlets—compared, for example, to 26% and 39%, respectively, for supermarkets and 20% and 23% for pet superstores—owners said they purchased pet products online more in the previous year. With dog owners, 50% said they bought more online, compared to 45% who said their online pet product purchasing stayed the same; for cat owners, the percentages were 48% and 46%, respectively.
Among dog and cat owners who bought pet food online, most preferred to pick up their purchases in the store or, just behind in terms of percentages, have the foods delivered to their homes; picking up curbside lagged a distant third. Additional survey questions indicated the home delivery option would increase in the coming year. It will be interesting to see when the next APPA survey is conducted at the end of 2022 whether that predicted change held true.
During her part of the webinar, Beaton also addressed the rise of pet food e-commerce, which she emphasized was accelerated by and during the pandemic. That acceleration will only continue, according to Packaged Facts data she presented: Pet food e-commerce sales in the U.S. will increase at an 18.8% compound annual growth rate (CAGR) through 2025, while brick-and-mortar sales will decrease by 1.7% CAGR.


